OLI data in fall, 2011(problem)
[1]:
%matplotlib inline
import pandas as pd
import numpy as np
# global configuration: show every rows and cols
pd.set_option('display.max_rows', None)
pd.set_option('max_colwidth',None)
pd.set_option('display.max_columns', None)
1. Data Description
1.1 Column Description
[2]:
# help_table3: the description for data by problems
df3 = pd.read_csv('OLI_data/help_table3.csv',sep=',',encoding="gbk")
df3 = df3.loc[:, ['Field', 'Annotation']]
df3
[2]:
| Field | Annotation | |
|---|---|---|
| 0 | Row | A row counter. |
| 1 | Sample | The sample that includes this problem. If you select more than one sample to export, problems that occur in more than one sample will be duplicated in the export. |
| 2 | Anon Student ID | The student that worked on the problem. |
| 3 | Problem Hierarchy | The location in the curriculum hierarchy where this problem occurs. |
| 4 | Problem Name | The name of the problem. |
| 5 | Problem View | The number of times the student encountered the problem so far. This counter increases with each instance of the same problem. See "Problem View" in the "By Student-Step" table above. |
| 6 | Problem Start Time | If the problem start time is not given in the original log data, then it is set to the time of the last transaction of the prior problem. If there is no prior problem for the session, the time of the earliest transaction is used. Earliest transaction time is equivalent to the minimum transaction time for the earliest step of the problem. For more detail on how problem start time is determined, see Determining Problem Start Time. |
| 7 | Problem End Time | Derived from the maximum transaction time of the latest step of the problem. |
| 8 | Latency (sec) | The amount of time the student spent on this problem. Specifically, the difference between the problem start time and the last transaction on this problem. |
| 9 | Steps Missing Start Times | The number of steps (from the student-step table) with "Step Start Time" values of "null". |
| 10 | Hints | Total number of hints the student requested for this problem. |
| 11 | Incorrects | Total number of incorrect attempts the student made on this problem. |
| 12 | Corrects | Total number of correct attempts the student made for this problem. |
| 13 | Avg Corrects | The total number of correct attempts / total number of steps in the problem. |
| 14 | Steps | Total number of steps the student took while working on the problem. |
| 15 | Avg Assistance Score | Calculated as (total hints requested + total incorrect attempts) / total steps. |
| 16 | Correct First Attempts | Total number of correct first attempts made by the student for this problem. |
| 17 | Condition | The name and type of the condition the student is assigned to. In the case of a student assigned to multiple conditions (factors in a factorial design), condition names are separated by a comma and space. This differs from the transaction format, which optionally has "Condition Name" and "Condition Type" columns. |
| 18 | KCs | Total number of KCs practiced by the student for this problem. |
| 19 | Steps without KCs | Total number of steps in this problem (performed by the student) without an assigned KC. |
| 20 | KC List | Comma-delimited list of KCs practiced by the student for this problem. |
1.2 Summarization of Data
This table organizes the data as student-problem
[3]:
df_problem =  pd.read_csv('OLI_data/AllData_problem_2011F.csv',low_memory=False) # sep="\t"
df_problem.head(2)
[3]:
| Row | Sample | Anon Student Id | Problem Hierarchy | Problem Name | Problem View | Problem Start Time | Problem End Time | Latency (sec) | Steps Missing Start Times | Hints | Incorrects | Corrects | Avg Corrects | Steps | Avg Assistance Score | Correct First Attempts | Condition | KCs (F2011) | Steps without KCs (F2011) | KC List (F2011) | KCs (Single-KC) | Steps without KCs (Single-KC) | KC List (Single-KC) | KCs (Unique-step) | Steps without KCs (Unique-step) | KC List (Unique-step) | |
|---|---|---|---|---|---|---|---|---|---|---|---|---|---|---|---|---|---|---|---|---|---|---|---|---|---|---|---|
| 0 | 1 | All Data | Stu_00b2b35fd027e7891e8a1a527125dd65 | sequence Statics, unit Concentrated Forces and Their Effects, module Introduction to Free Body Diagrams | _m2_assess | 1 | 2011/9/21 17:35 | 2011/9/21 17:35 | 0 | 0 | 0 | 9 | 12 | 0.571 | 21 | 0.429 | 12 | NaN | 5 | 0 | gravitational_forces, identify_interaction, represent_interaction_cord, represent_interaction_spring, simple_step | 1 | 0 | Single-KC | 0 | 21 | . |
| 1 | 2 | All Data | Stu_00b2b35fd027e7891e8a1a527125dd65 | sequence Statics, unit Concentrated Forces and Their Effects, module Effects of Force | tutor_03_01 | 1 | 2011/9/21 17:49 | 2011/9/21 17:49 | 9 | 0 | 0 | 0 | 3 | 1.000 | 3 | 0.000 | 3 | NaN | 1 | 0 | distinguish_rotation_translation | 1 | 0 | Single-KC | 3 | 0 | KC523, KC680, KC768 |
2. Data Analysis
[4]:
df_problem.describe()
[4]:
| Row | Problem View | Latency (sec) | Steps Missing Start Times | Hints | Incorrects | Corrects | Avg Corrects | Steps | Avg Assistance Score | Correct First Attempts | Condition | KCs (F2011) | Steps without KCs (F2011) | KCs (Single-KC) | Steps without KCs (Single-KC) | KCs (Unique-step) | Steps without KCs (Unique-step) | |
|---|---|---|---|---|---|---|---|---|---|---|---|---|---|---|---|---|---|---|
| count | 45002.000000 | 45002.000000 | 45002.000000 | 45002.000000 | 45002.000000 | 45002.000000 | 45002.000000 | 45002.000000 | 45002.000000 | 45002.000000 | 45002.000000 | 0.0 | 45002.000000 | 45002.000000 | 45002.0 | 45002.0 | 45002.000000 | 45002.000000 |
| mean | 22501.500000 | 1.221146 | 85.639883 | 0.007000 | 0.620217 | 1.644460 | 4.176325 | 0.959571 | 4.331963 | 0.928014 | 3.219479 | NaN | 1.223923 | 1.798920 | 1.0 | 0.0 | 4.289654 | 0.042309 |
| std | 12991.102744 | 1.140622 | 301.895374 | 0.106748 | 1.956302 | 3.378211 | 5.125742 | 0.358850 | 5.079484 | 2.221907 | 4.603916 | NaN | 1.733856 | 3.830471 | 0.0 | 0.0 | 5.084490 | 0.557118 |
| min | 1.000000 | 1.000000 | 0.000000 | 0.000000 | 0.000000 | 0.000000 | 0.000000 | 0.000000 | 1.000000 | 0.000000 | 0.000000 | NaN | 0.000000 | 0.000000 | 1.0 | 0.0 | 0.000000 | 0.000000 |
| 25% | 11251.250000 | 1.000000 | 0.000000 | 0.000000 | 0.000000 | 0.000000 | 1.000000 | 1.000000 | 1.000000 | 0.000000 | 1.000000 | NaN | 0.000000 | 0.000000 | 1.0 | 0.0 | 1.000000 | 0.000000 |
| 50% | 22501.500000 | 1.000000 | 20.000000 | 0.000000 | 0.000000 | 1.000000 | 3.000000 | 1.000000 | 3.000000 | 0.250000 | 2.000000 | NaN | 1.000000 | 0.000000 | 1.0 | 0.0 | 3.000000 | 0.000000 |
| 75% | 33751.750000 | 1.000000 | 73.000000 | 0.000000 | 0.000000 | 2.000000 | 5.000000 | 1.000000 | 5.000000 | 1.000000 | 4.000000 | NaN | 2.000000 | 2.000000 | 1.0 | 0.0 | 5.000000 | 0.000000 |
| max | 45002.000000 | 32.000000 | 20426.000000 | 8.000000 | 50.000000 | 413.000000 | 232.000000 | 19.333000 | 32.000000 | 210.500000 | 32.000000 | NaN | 9.000000 | 32.000000 | 1.0 | 0.0 | 32.000000 | 29.000000 |
(1)Analysis for Null and Unique value of column attributes
[5]:
def work_col_analysis(df_work):
    num_nonull_toal = df_work.notnull().sum()  # Not Null
    dict_col_1 = {'col_name':num_nonull_toal.index,'num_nonull':num_nonull_toal.values}
    df_work_col_1 = pd.DataFrame(dict_col_1)

    num_null_toal = df_work.isnull().sum()  # Null
    dict_col_2 = {'col_name':num_null_toal.index,'num_null':num_null_toal.values}
    df_work_col_2 = pd.DataFrame(dict_col_2)

    num_unique_toal = df_work.apply(lambda col: len(col.unique()))   # axis=0
    print(type(num_unique_toal))
    dict_col_3 = {'col_name':num_unique_toal.index,'num_unique':num_unique_toal.values}
    df_work_col_3 = pd.DataFrame(dict_col_3)

    df_work_col = pd.merge(df_work_col_1, df_work_col_2, on=['col_name'])
    df_work_col = pd.merge(df_work_col, df_work_col_3, on=['col_name'])
    return df_work_col
print("-------------------num_unique_toal and num_nonull_toal----------------------")
df_result = work_col_analysis(df_problem)
df_result
-------------------num_unique_toal and num_nonull_toal----------------------
<class 'pandas.core.series.Series'>
[5]:
| col_name | num_nonull | num_null | num_unique | |
|---|---|---|---|---|
| 0 | Row | 45002 | 0 | 45002 |
| 1 | Sample | 45002 | 0 | 1 |
| 2 | Anon Student Id | 45002 | 0 | 333 |
| 3 | Problem Hierarchy | 45002 | 0 | 27 |
| 4 | Problem Name | 45002 | 0 | 300 |
| 5 | Problem View | 45002 | 0 | 32 |
| 6 | Problem Start Time | 45002 | 0 | 25983 |
| 7 | Problem End Time | 45002 | 0 | 25884 |
| 8 | Latency (sec) | 45002 | 0 | 1290 |
| 9 | Steps Missing Start Times | 45002 | 0 | 8 |
| 10 | Hints | 45002 | 0 | 35 |
| 11 | Incorrects | 45002 | 0 | 37 |
| 12 | Corrects | 45002 | 0 | 51 |
| 13 | Avg Corrects | 45002 | 0 | 195 |
| 14 | Steps | 45002 | 0 | 31 |
| 15 | Avg Assistance Score | 45002 | 0 | 335 |
| 16 | Correct First Attempts | 45002 | 0 | 33 |
| 17 | Condition | 0 | 45002 | 1 |
| 18 | KCs (F2011) | 45002 | 0 | 10 |
| 19 | Steps without KCs (F2011) | 45002 | 0 | 31 |
| 20 | KC List (F2011) | 45002 | 0 | 170 |
| 21 | KCs (Single-KC) | 45002 | 0 | 1 |
| 22 | Steps without KCs (Single-KC) | 45002 | 0 | 1 |
| 23 | KC List (Single-KC) | 45002 | 0 | 1 |
| 24 | KCs (Unique-step) | 45002 | 0 | 32 |
| 25 | Steps without KCs (Unique-step) | 45002 | 0 | 16 |
| 26 | KC List (Unique-step) | 45002 | 0 | 1470 |
(2)Analysis for Discrete value of column attributes
Columns with a small number of discrete values may represent very informative, so identify these columns first and analyze them one by one
[6]:
discrete_cols = []
series = []
cols = list(df_problem.columns.values)

for col in cols:
    if len(df_problem[col].unique().tolist()) <= 20 and len(df_problem[col].unique().tolist()) >= 2:
        discrete_cols.append(col)
        series.append(df_problem[col].unique().tolist())

for a,b in zip(discrete_cols,series):
    print(a," : ",b)
    print("-"*80)
Steps Missing Start Times  :  [0, 1, 2, 5, 7, 6, 3, 8]
--------------------------------------------------------------------------------
KCs (F2011)  :  [5, 1, 4, 2, 3, 9, 0, 8, 6, 7]
--------------------------------------------------------------------------------
Steps without KCs (Unique-step)  :  [21, 0, 17, 15, 9, 2, 5, 1, 4, 3, 12, 10, 8, 11, 14, 29]
--------------------------------------------------------------------------------
(3)Data Cleaning
Data Cleaning Suggestions - Redundant columns: Columns that are all NULL or Single value. - Others
[7]:
df_problem_clear = df_problem.copy(deep=True) # deep copy
[8]:
# Clear all redundant columns directly.
cols = list(df_problem.columns.values)
drop_cols = []
for col in cols:
    if len(df_problem_clear[col].unique().tolist()) == 1:
        df_problem_clear.drop(col,axis =1,inplace=True)
        drop_cols.append(col)

print("the cols num before clear: ",len(df_problem.columns.to_list()))
print("the cols num after clear:",len(df_problem_clear.columns.to_list()))
for col in drop_cols:
    print("drop:---",col)
the cols num before clear:  27
the cols num after clear: 22
drop:--- Sample
drop:--- Condition
drop:--- KCs (Single-KC)
drop:--- Steps without KCs (Single-KC)
drop:--- KC List (Single-KC)
[9]:
df_problem_clear.head(2)
[9]:
| Row | Anon Student Id | Problem Hierarchy | Problem Name | Problem View | Problem Start Time | Problem End Time | Latency (sec) | Steps Missing Start Times | Hints | Incorrects | Corrects | Avg Corrects | Steps | Avg Assistance Score | Correct First Attempts | KCs (F2011) | Steps without KCs (F2011) | KC List (F2011) | KCs (Unique-step) | Steps without KCs (Unique-step) | KC List (Unique-step) | |
|---|---|---|---|---|---|---|---|---|---|---|---|---|---|---|---|---|---|---|---|---|---|---|
| 0 | 1 | Stu_00b2b35fd027e7891e8a1a527125dd65 | sequence Statics, unit Concentrated Forces and Their Effects, module Introduction to Free Body Diagrams | _m2_assess | 1 | 2011/9/21 17:35 | 2011/9/21 17:35 | 0 | 0 | 0 | 9 | 12 | 0.571 | 21 | 0.429 | 12 | 5 | 0 | gravitational_forces, identify_interaction, represent_interaction_cord, represent_interaction_spring, simple_step | 0 | 21 | . |
| 1 | 2 | Stu_00b2b35fd027e7891e8a1a527125dd65 | sequence Statics, unit Concentrated Forces and Their Effects, module Effects of Force | tutor_03_01 | 1 | 2011/9/21 17:49 | 2011/9/21 17:49 | 9 | 0 | 0 | 0 | 3 | 1.000 | 3 | 0.000 | 3 | 1 | 0 | distinguish_rotation_translation | 3 | 0 | KC523, KC680, KC768 |
[10]:
# the remaining columns
print("-------------------num_unique_toal and num_nonull_toal----------------------")
df_result = work_col_analysis(df_problem_clear)
df_result
-------------------num_unique_toal and num_nonull_toal----------------------
<class 'pandas.core.series.Series'>
[10]:
| col_name | num_nonull | num_null | num_unique | |
|---|---|---|---|---|
| 0 | Row | 45002 | 0 | 45002 |
| 1 | Anon Student Id | 45002 | 0 | 333 |
| 2 | Problem Hierarchy | 45002 | 0 | 27 |
| 3 | Problem Name | 45002 | 0 | 300 |
| 4 | Problem View | 45002 | 0 | 32 |
| 5 | Problem Start Time | 45002 | 0 | 25983 |
| 6 | Problem End Time | 45002 | 0 | 25884 |
| 7 | Latency (sec) | 45002 | 0 | 1290 |
| 8 | Steps Missing Start Times | 45002 | 0 | 8 |
| 9 | Hints | 45002 | 0 | 35 |
| 10 | Incorrects | 45002 | 0 | 37 |
| 11 | Corrects | 45002 | 0 | 51 |
| 12 | Avg Corrects | 45002 | 0 | 195 |
| 13 | Steps | 45002 | 0 | 31 |
| 14 | Avg Assistance Score | 45002 | 0 | 335 |
| 15 | Correct First Attempts | 45002 | 0 | 33 |
| 16 | KCs (F2011) | 45002 | 0 | 10 |
| 17 | Steps without KCs (F2011) | 45002 | 0 | 31 |
| 18 | KC List (F2011) | 45002 | 0 | 170 |
| 19 | KCs (Unique-step) | 45002 | 0 | 32 |
| 20 | Steps without KCs (Unique-step) | 45002 | 0 | 16 |
| 21 | KC List (Unique-step) | 45002 | 0 | 1470 |
3. Data Visualization
[11]:
import plotly.express as px
from plotly.subplots import make_subplots
import plotly.graph_objs as go
import matplotlib.pyplot as plt
[12]:
# The distribution of continuous values
def show_value_counts_histogram(colname, sort = True):
    # create the bins
    start = int(df_problem_clear[colname].min()/10)*10
    end = int(df_problem_clear[colname].quantile(q=0.95)/10+1)*10
    problem = int((end - start)/20)
    print(start, end, problem)
    counts, bins = np.histogram(df_problem_clear[colname],bins=range(start, end, problem))
    bins = 0.5 * (bins[:-1] + bins[1:])

    fig = px.bar(x=bins, y=counts, labels={'x': colname, 'y':'count'})
    fig.show("svg")

# Box distribution of continuous values
def show_value_counts_box(colname, sort = True):
    # way1: plotly (too costy for box-plot)
    # fig = px.box(df_problem_clear, y=colname)
    # fig.show("svg")
    # way2: matplotlib
    plt.figure(figsize=(10,5))
    plt.title('Box-plot for '+ colname,fontsize=20)#标题,并设定字号大小
    plt.boxplot([df_problem_clear[colname].tolist()])
    plt.show("svg")

# Histogram of discrete values
def show_value_counts_bar(colname, sort = True):
    ds = df_problem_clear[colname].value_counts().reset_index()
    ds.columns = [
        colname,
        'Count'
    ]
    if sort:
        ds = ds.sort_values(by='Count', ascending=False)
    # histogram
    fig = px.bar(
        ds,
        x = colname,
        y = 'Count',
        title = colname + ' distribution'
    )
    fig.show("svg")


# Pie of discrete values
def show_value_counts_pie(colname, sort = True):
    ds = df_problem_clear[colname].value_counts().reset_index()
    ds.columns = [
        colname,
        'percent'
    ]
    ds['percent'] /= len(df_problem_clear)
    if sort:
        ds = ds.sort_values(by='percent', ascending=False)
    fig = px.pie(
        ds,
        names = colname,
        values = 'percent',
        title = colname+ 'Percentage',
    )
    fig.show("svg")
(1)sort by single attributes
[13]:
# Bar
show_value_counts_bar('KCs (F2011)')
show_value_counts_bar('Problem Hierarchy')


[14]:
# analysis for "duration"
# It is obvious that there are unreasonable outliers

show_value_counts_box('Latency (sec)')
show_value_counts_histogram('Latency (sec)')
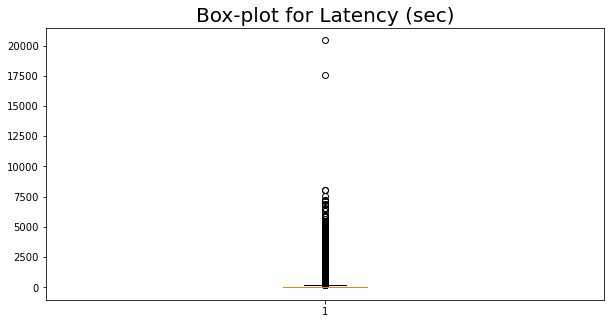
0 340 17

(2)group by Problem Name, sorted by meam(avg corrects)
[15]:
# Classification Statistic

# Problem Name,Avg Corrects, Avg Assistance Score
df_problem_group1 = df_problem_clear.groupby(['Problem Name'])['Avg Corrects'].mean().reset_index()
df_problem_group1.columns = ["Problem Name","Avg Corrects"]
df_problem_group1 = df_problem_group1.sort_values(by='Avg Corrects', ascending=False)
fig = px.bar(df_problem_group1, x="Problem Name", y="Avg Corrects", title="Questions sorted by the average accuracy")
fig.show("svg")
